Download {shiny} daily download counts
For a recent presentation for the {shiny} package, I needed a plot showing the number of downloads since first {shiny} was released.
The {cranlogs} package came in handy.
Note that this package only downloads from the
RStudio CRAN mirror. RStudio mirror is not the only CRAN mirror.
According to the package documentation, “it’s a popular one: it’s
the default choice for RStudio users. The actual number of downloads
over all CRAN mirrors is unknown.”
The libraries
shiny_logs <- cran_downloads("shiny", from = "2013-01-01", to = "2022-09-19")

shiny_logs <- shiny_logs %>% filter(count>0)

shiny_logs %>%
  as_tibble() %>%
  mutate(total = cumsum(count)) %>% # in case we need the total downloads up a point
  ggplot(
    aes(x = date, y = count)
  )+
  geom_line()+
  scale_y_continuous(labels = scales::label_number(suffix = "K", scale = 1e-3))+
  labs(y = "", x = "Year",
       title = "Number of daily downloads for the Shiny package in R",
       subtitle =
         glue::glue("Period: {format(min(shiny_logs$date), '%d/%m/%Y')} - {format(max(shiny_logs$date),'%d/%m/%Y')}"),
       caption = "Counts extracted using the {cranlogs} package\
       RSTUDIO CRAN package mirror at http://cran-logs.rstudio.com."
       )+
  theme_bw()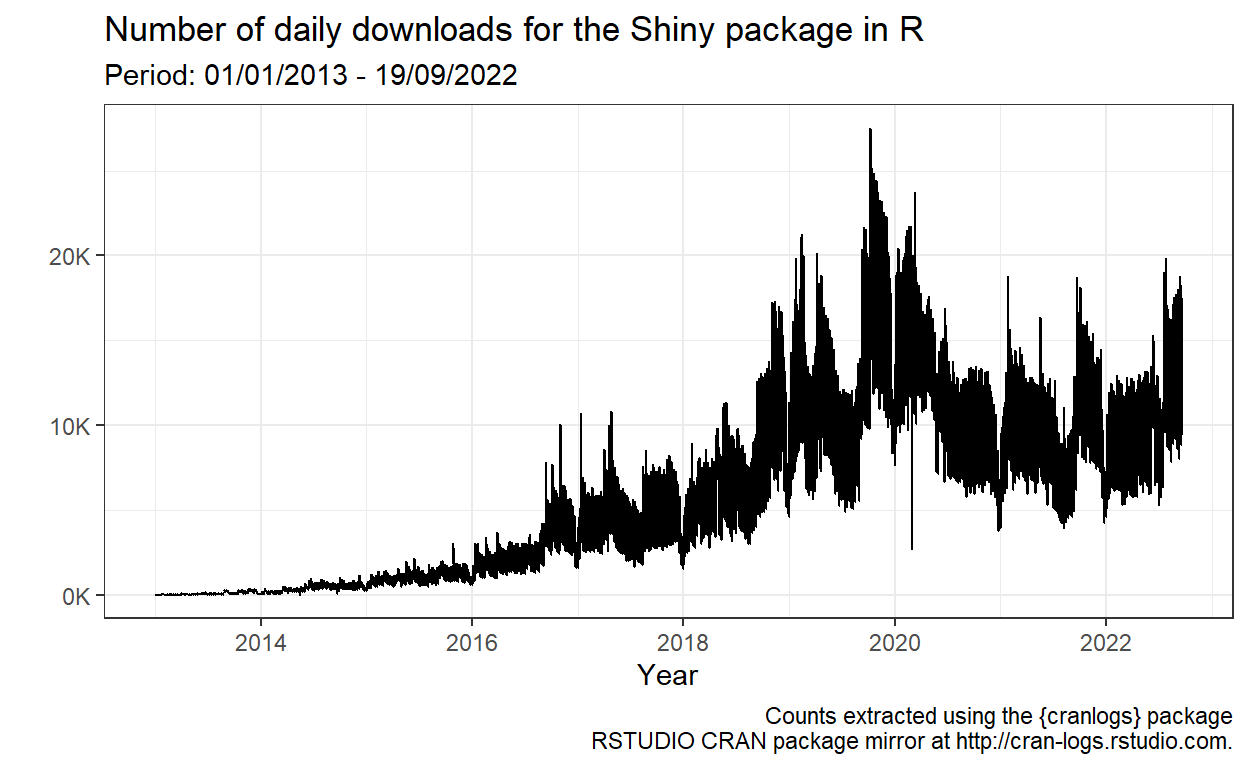
How R is doing?
When downloading download-counts for R, we get the daily counts for
every version of R and for every operating system. Hence, the table
could be really big (and take some time to download). This is a sample
of the last available day’s downloads. Notice the version
and the os column.
cran_downloads("R") %>% head() date version os count
1 2022-09-22 4.2.1 win 8473
2 2022-09-22 2.12.0 src 1
3 2022-09-22 3.1.0 osx 1
4 2022-09-22 2.9.0 src 1
5 2022-09-22 3.4.4 win 3
6 2022-09-22 2.3.1 src 1Let’s see only the last 6 months or so
r_logs <- cran_downloads("R", from = Sys.Date() - 6*30, to = Sys.Date())

r_logs %>%
  as_tibble() %>%
  group_by(date) %>%
  summarise(count = sum(count)) %>%
  ungroup() %>%
  mutate(total = cumsum(count)) %>% # in case we need the total downloads up a point
  ggplot(
    aes(x = date, y = count)
  )+
  scale_x_date(date_breaks = "2 weeks", labels = function(x) format(x, "%d/%m"))+
  geom_line()+
  scale_y_continuous(labels = scales::label_number(suffix = "K", scale = 1e-3))+
  labs(y = "", x = "",
       title = glue("R daily downloads since {format(min(r_logs$date), '%d/%m/%Y')}"),
       subtitle = glue::glue("Period: {format(min(r_logs$date), '%d/%m/%Y')} - {format(max(r_logs$date), '%d/%m/%Y')}"),
       caption = "Counts extracted using the {cranlogs} package\
       RSTUDIO CRAN package mirror at http://cran-logs.rstudio.com."
  )+
  theme_bw()